

Member Retention Metrics Every Membership Manager Should Track

Track three numbers this week: overall retention rate, first-year retention, and your Month 3 cohort baseline. Calculate the last 12 months of overall and first-year retention, then build a signup-month cohort table for your last 6 to 12 cohorts to see where new members actually drop off.
That single M3 cutoff separates people who never got past onboarding from your foundational, long-term base — and it usually explains more than any other number you’re staring at.
Here’s the priority list, in order:
- Overall retention rate — your blended health check across the whole member base
- First-year retention — almost always lower than overall, and the real signal of onboarding quality
- Cohort retention by signup month — where you catch problems before they show up in the aggregate
- Churn rate — the inverse view, useful for framing loss in dollar and headcount terms
- Member lifetime value (LTV) — what retention is actually worth to your bottom line
Retaining an existing member costs a fraction of acquiring a new one, commonly cited at 5 to 7 times cheaper, which is why a small bump in retention moves profit far more than an equivalent bump in sign-ups.
Key Takeaways
Membership organizations that pair first-year retention tracking with Month 3 cohort baselines catch onboarding failures months before they show up in overall retention numbers.
PointDetails
Track three core numbers
Overall retention, first-year retention, and M3 cohort baseline diagnose most churn issues.
Use the standard formula
(Members at end − new members) ÷ members at start × 100 calculates retention accurately.
Rebase cohorts at Month 3
This separates short-term tourists from your foundational long-term member base.
Watch the 90-day window
First-year retention runs lower than overall retention and signals onboarding quality.
Automate preventable churn
Renewal reminders and auto-billing recover members who lapse simply by forgetting.
Table of Contents
- Core Member Retention Metrics: Definitions and Formulas
- What Is Cohort Retention Analysis and Why Does It Matter?
- How to Calculate These Metrics Step by Step
- What’s a Good Retention Rate for Membership Organizations?
- Turning Retention Data Into Action
- Building a Retention Dashboard That Actually Gets Used
- How Fitness Flow Uses Analytics to Lift Gym Retention
- See How Automated Retention Tracking Works in Practice
- Editorial Take: What the Data Actually Supports
- Sources
Core Member Retention Metrics: Definitions and Formulas
Every retention conversation should start with the same formula, because it’s the one number that ties everything else together.
Overall member retention rate measures what share of your existing members stuck around over a period, excluding new sign-ups from the count. The standard calculation is:
((Members at End of Period − New Members During Period) ÷ Members at Start of Period) × 100
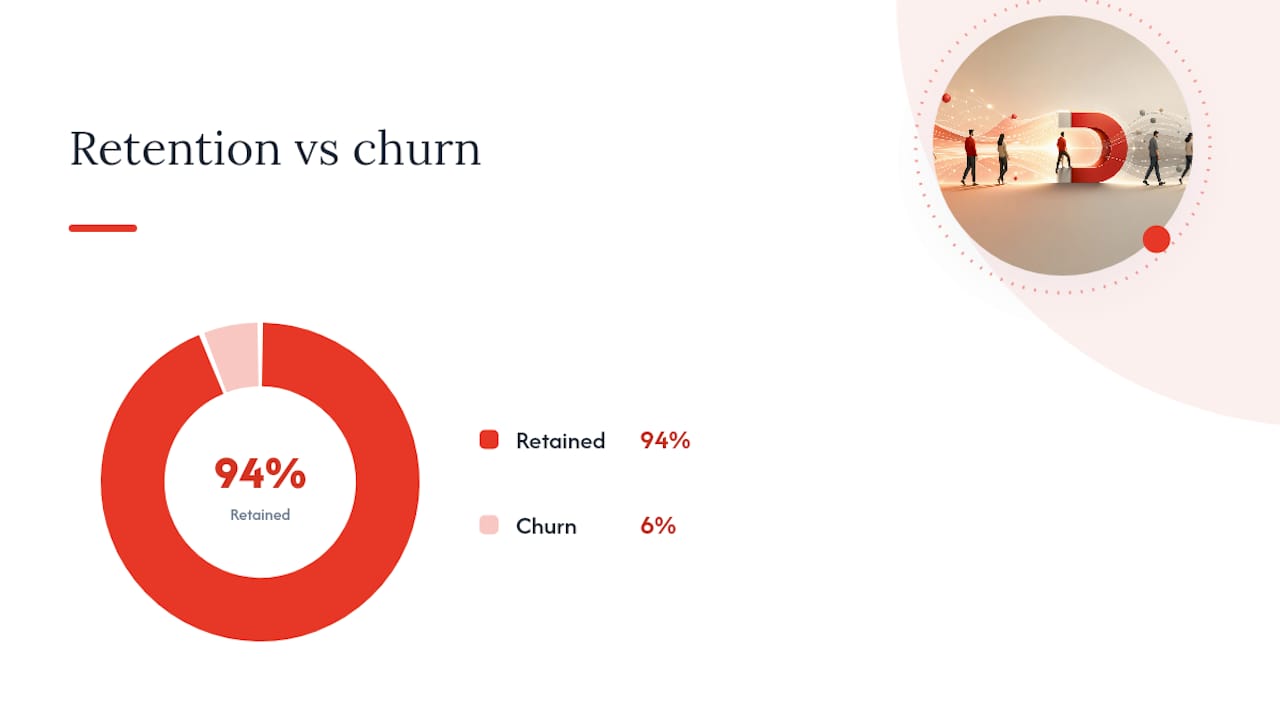
That’s the exact method used across the membership industry. Say you start January with 500 members, add 40 new sign-ups, and end the month at 510. Your retention rate is ((510 − 40) ÷ 500) × 100 = 94%.
Here’s how the core metrics compare:
MetricFormulaWhat it tells you
Overall retention rate
(End − New) ÷ Start × 100
Blended health of the whole base
Churn rate
100% − retention rate
Loss framed as a percentage
First-year retention
Members retained past month 12 ÷ new members from that cohort × 100
Onboarding and early-stage stickiness
Gross revenue retention (GRR)
(Starting recurring revenue − downgrades − cancellations) ÷ Starting recurring revenue × 100
Revenue held without counting upsells
Net revenue retention (NRR)
(Starting revenue + expansion − downgrades − cancellations) ÷ Starting revenue × 100
Revenue trend including upgrades
A few things worth knowing before you build your own tracker:
- Churn and retention are mirror images. If retention is 94%, churn is 6%. Track whichever framing your board or leadership responds to better, but never report both without noting they’re the same underlying number.
- First-year retention almost always runs lower than blended retention. New members haven’t built habits yet, so this bucket carries the highest risk. Blending it into your overall number hides the real problem.
- GRR and NRR matter most for paid tiers, add-ons, or event-based revenue. A gym with a single flat membership fee doesn’t need NRR tracking. A studio selling personal training packages, retail, and tiered memberships does, because expansion revenue can mask member-count losses.
- LTV depends entirely on retention. A rough LTV formula is average monthly revenue per member divided by your monthly churn rate. Improve retention from 90% to 95% churn (10% to 5% monthly churn), and LTV doubles without touching pricing or acquisition spend.
What Is Cohort Retention Analysis and Why Does It Matter?
A blended retention number hides more than it reveals. Cohort retention analysis fixes that by grouping members according to when they joined, then tracking what percentage of each group is still active at each subsequent milestone.

A cohort is simply a group defined by a shared starting point, most often signup month. You then pick a retention event, usually “still an active paying member,” and measure it at fixed intervals: Month 1, Month 3, Month 6, Month 12.
Building the matrix is mechanical once you set it up:
- Rows represent each monthly cohort (January sign-ups, February sign-ups, and so on)
- Columns represent time elapsed since joining (M0, M1, M2, M3…)
- Each cell shows the percentage of that cohort still active at that point, normalized so every row starts at 100%
Once the matrix is built, the shape of the curve tells you what’s actually happening. A curve that drops steeply in the first two months and then flattens signals a normal filtering effect, tourists sorting themselves out from committed members. A curve that never flattens and keeps bleeding members month after month points to a deeper product or value problem. Occasionally you’ll see a “smile curve,” where retention dips and then climbs back up. This usually means members who stick past a rough patch discover value they missed early, often a signal that your onboarding needs to surface that value sooner.
Pro Tip: Rebase your cohort comparisons at Month 3 instead of Month 0. This M3 rebase approach strips out short-term tourists and shows you the retention curve of members who actually gave your service a fair shot, which is a far more honest number for forecasting.
How to Calculate These Metrics Step by Step
You don’t need specialized software to start this analysis. A spreadsheet and a clean export from your billing or CRM system get you most of the way there.
- Pull your data checklist first. You need member ID, join date, current status (active or canceled), renewal date, revenue per member, and acquisition channel. Missing any of these will limit what you can calculate later.
- Pick your period and count four numbers: members at the start, members at the end, new members added, and members lost. Plug those into the retention formula above.
- Build the cohort table. In a new sheet, list signup month down the rows and months-since-joining across the columns. For each cohort, count how many members from that signup month are still active at each interval, then convert to a percentage of that cohort’s starting size.
- Set up a simple pivot using join month as rows and status as values to speed up the cohort count instead of manually filtering each month.
- Surface two trend lines on a dashboard: monthly overall retention and first-year retention by cohort, updated at the start of each month.
What’s a Good Retention Rate for Membership Organizations?
Retention benchmarks vary a lot by price point and membership model, so treat these as directional bands rather than hard targets.
- Crisis territory: overall retention below 60%, or first-year retention under 40%
- Warning zone: overall retention in the 60 to 75% range
- Average performance: overall retention around 75 to 85%
- Strong performance: overall retention above 85%, moving toward the 78% to 85%+ range that top-performing membership organizations report
First-year retention will almost always sit below your overall number, sometimes by a wide margin, because the first 90 days carry the highest risk of loss. Treat that window as the period where most preventable churn happens.
Escalate when first-year retention drops materially below your overall rate, or when a cohort curve keeps declining past Month 6 instead of flattening. Either pattern means something in onboarding or ongoing value delivery is broken, not just a seasonal blip.
Turning Retention Data Into Action
Metrics only matter if they trigger something. The leading indicators worth watching daily or weekly, before they show up as a cancellation, are login frequency, class or session bookings, app engagement, and profile completion. A member who hasn’t logged in or booked anything in two weeks is a churn signal months before their renewal date arrives.
Build your intervention calendar around three checkpoints:
- Day 1 to 30: Deliver an “open-loop” onboarding sequence that gets the member a measurable early win, a completed first workout, a booked class, a filled-out goal profile, within the first week.
- Day 31 to 60: Invite the member into a community touchpoint, a group class, a challenge, or a check-in message, and flag anyone with zero activity as at-risk.
- Day 61 to 90: Personally reach out to at-risk members before the 90-day mark, since this window determines whether they convert into long-term members or quietly lapse.
Automate what you can. Nearly a third of members who lapse do so simply because they forgot to renew, so renewal reminders and auto-billing enrollment recover churn you’d otherwise chalk up to disengagement. Set at-risk alert triggers based on activity drop-off, not just missed payments.
Pro Tip: Run interventions as small experiments, not blanket policy changes. Split a cohort into two groups, apply your new onboarding sequence to one, and compare their M3 retention against the control group. That’s how you know the intervention actually moved the number instead of just feeling productive.
Building a Retention Dashboard That Actually Gets Used
Keep your dashboard to a handful of numbers, because a crowded dashboard gets ignored within a month. A workable minimal set includes:
- Overall retention rate (monthly)
- First-year retention rate (rolling 12 months)
- M3 cohort baseline for the last 6 cohorts
- Current at-risk member count
- Win-back rate for lapsed members
- Auto-renew enrollment percentage
Review the monthly KPIs at the start of each month and check engagement signals weekly. Set a trigger level, say, a 5-point drop in M3 baseline compared to the trailing average, that forces a review meeting rather than waiting for the annual report to reveal the problem.
Data hygiene matters more than people expect here. Define “active” the same way across every report (paid and not canceled, versus logged in within 30 days) and keep join dates and renewal dates in a consistent format, or your cohort table will silently misalign.
How Fitness Flow Uses Analytics to Lift Gym Retention
Gyms face the same onboarding-leak problem as any membership business, just compressed into a shorter window. New members either build a habit in the first month or they don’t come back.
Getfitnessflow built its platform around that reality. The branded member app keeps members connected between visits through live and on-demand classes and gamified engagement features, while automated workflows handle renewal reminders, at-risk alerts, and onboarding sequences without manual follow-up from staff.
Gyms using Fitness Flow’s analytics and automation see a 27% average increase in member retention, alongside 12 hours saved on administrative tasks every week.
That kind of lift maps directly to the cohort methodology above: automation catches at-risk members before the 90-day cliff, and the analytics layer makes M3 baselines visible without manual spreadsheet work.
See How Automated Retention Tracking Works in Practice
Calculating retention by hand in a spreadsheet works fine for a single location with a few hundred members. It gets unwieldy fast once you’re running multiple locations, tiered pricing, or a mix of memberships and class packages, and manually rebuilding cohort tables every month eats hours you don’t have.
Getfitnessflow was built specifically for that gap. Beyond the branded member app and gamified engagement tools, the platform’s analytics dashboard tracks retention, churn, and cohort trends automatically, so at-risk members surface before they cancel instead of after. Combined with automated billing and renewal reminders, it addresses the exact “forgot to renew” churn that drains preventable revenue. If you’re managing a gym or studio and want to see the retention analytics and automation in action, a demo walks through how the dashboard maps directly to the metrics covered here.
Editorial Take: What the Data Actually Supports
Most membership advice treats retention as a single number to improve, and that’s the core mistake. Overall retention is a lagging indicator dressed up as a management metric. By the time it moves, the members who mattered already left months earlier during their first 90 days.
The conventional playbook (send a survey, offer a discount, hope for the best) fails because it reacts to cancellations instead of the cohort curve that predicted them weeks in advance. If your first-year retention sits meaningfully below your overall number, no discount fixes that. Only better onboarding does.
What I’d prioritize first, ahead of dashboards or benchmarks: build one cohort table, rebased at Month 3, before doing anything else. Everything else in this guide, the alert triggers, the intervention calendar, the automation, only works once you know exactly where your specific members are falling off. Guessing at benchmarks without that table is optimizing blind.
— Louis
Sources
- Retention Guide: Move from 78% to 85%+ | i4a
- Membership retention rate formula | Membership Quest
- Cohort Retention Analysis in 2026: How to Separate Real Users From AI Tourists | Userpilot
- 15 Member Retention Strategies | Outseta